
THE CHART PACK
The Pareto chart with its cumulative percentage column built — the part the built-in version hides. Plus 21 more advanced charts, free.
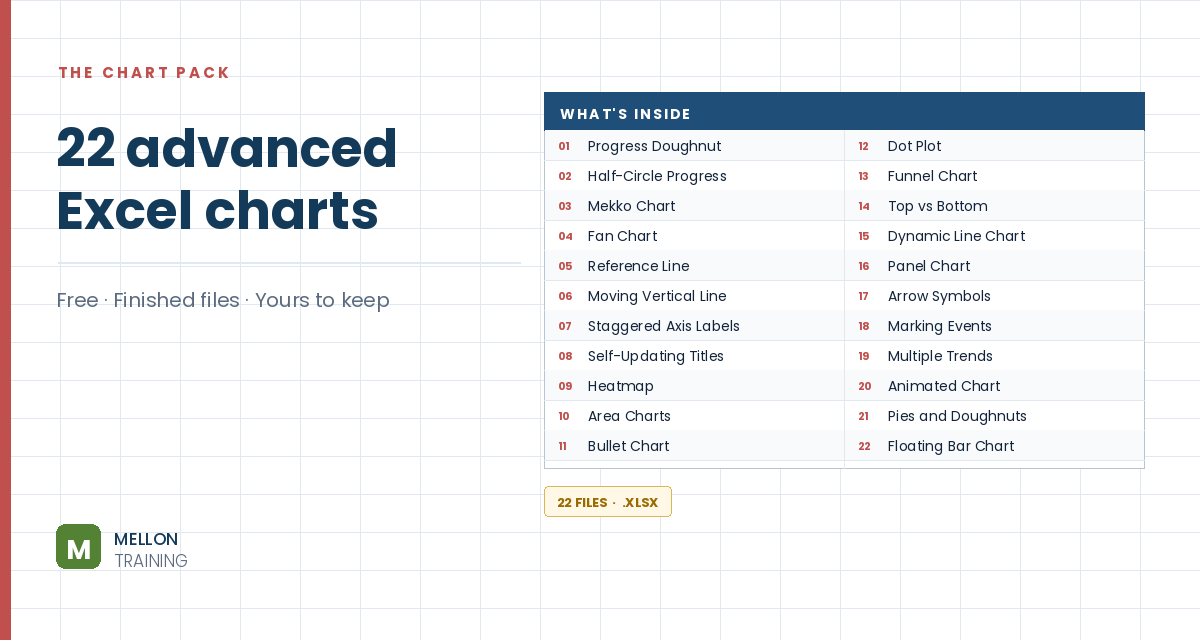
What’s in the pack
Free, instant, and yours to keep.
No spam, ever. Unsubscribe with one click.
One practical Excel tip a week.
Watch the 3-minute video or follow the written steps below. The workbook, with the cumulative percentage column built, is in the free pack above.
A Pareto chart combines columns sorted from largest to smallest with a cumulative percentage line, so you can see which few items account for most of the total: the 80/20 rule. Since Excel 2016 there’s a built-in Pareto chart that does the sorting and the percentages for you, with no formulas.
You need one column of categories (states, in the example) and one column of values (sales). The data doesn’t need to be sorted, and you don’t need a cumulative percentage column.
Click inside the data, go to Insert and open Statistical Charts (the icon is easy to miss), then choose Pareto under Histogram. Excel sorts the columns in descending order behind the scenes and adds the cumulative percentage line on a secondary axis.
If you’ve already made a column chart, select it and go to Change Chart Type. Pareto isn’t listed on its own: click Histogram and choose the second option, Pareto.
Follow the line against the percentage axis on the right. In the example, just three states (California, Texas and Florida) make up about 75% of sales. Those are the few items worth focusing on.
The built-in chart is the fastest route, but it keeps the cumulative percentages to itself: you can’t put them in a report, filter them or reuse them. If you need those numbers, build the chart by hand with a cumulative percentage column, as in the manual Pareto chart tutorial.
YOUR NEXT STEP
Excel’s built-in Pareto works out the cumulative percentage internally and keeps it. So you can see the 80/20 split but can’t put it in a report, filter it, or chart it another way. That gap between what the button does and what the job needs is what the course is really about — 50+ charts, and when each one is the right answer.
30-day money-back guarantee, handled by Udemy. No forms, no questions.
★★★★★ Join 80,000+ students
Andreas Exadaktylos · Microsoft-certified Excel instructor · mellontraining.com
WATCHING ON YOUTUBE?
11 step-by-step courses on Excel, Power BI, Python and AI, all on Udemy with lifetime access.