
Prefer reading? The same steps are written out below the video.
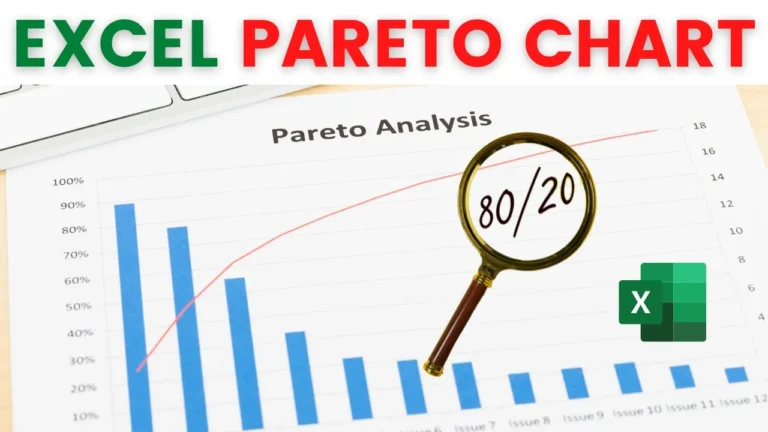
The example uses two columns: item category and sales. The finished chart shows sales as columns and the cumulative percentage as a line.
This matters: a Pareto chart only works when the values are in descending order. Click any value in the sales column, then go to Home > Sort & Filter > Sort Largest to Smallest.
Click the cell under the last sales value (B9 in the example), click AutoSum and press Enter.
Type Cumulative as the header in column C. The first entry is just the first sales value, so in C2 type =B2. Every row after that adds the previous cumulative total to the current sales value, so in C3 type =C2+B3. Then double-click the fill handle to copy it down.
Type Percent as the header in column D. In D2, divide the cumulative value by the total: =C2/$B$9. Press F4 after clicking B9 to make it an absolute reference, so it stays fixed as you copy the formula down. Fill it down, then click Percent Style on the Home tab.
Select the category, sales and percent columns, but not the cumulative column (hold Ctrl to select columns that aren’t next to each other). Go to Insert > Recommended Charts. The first suggestion, Clustered Column – Line on Secondary Axis, is exactly what you need. Click OK.
Click the line, then go to Chart Design > Add Chart Element > Data Labels > Below, so each point shows its exact percentage.
In the example, the first three categories (refreshments, spirits and mineral water) make up almost 80% of total sales. That’s the “vital few” a Pareto chart is designed to reveal.
My course Excel Charts, Infographics & Data Visualisation walks through 50+ advanced, dynamic charts in 90 lessons.
WATCHING ON YOUTUBE?
11 step-by-step courses on Excel, Power BI, Python and AI, all on Udemy with lifetime access.