
THE CHART PACK
Mekko, fan chart, bullet, gauge, waterfall — the ones Excel won’t build for you. All finished and working. Free, instant, yours to keep.
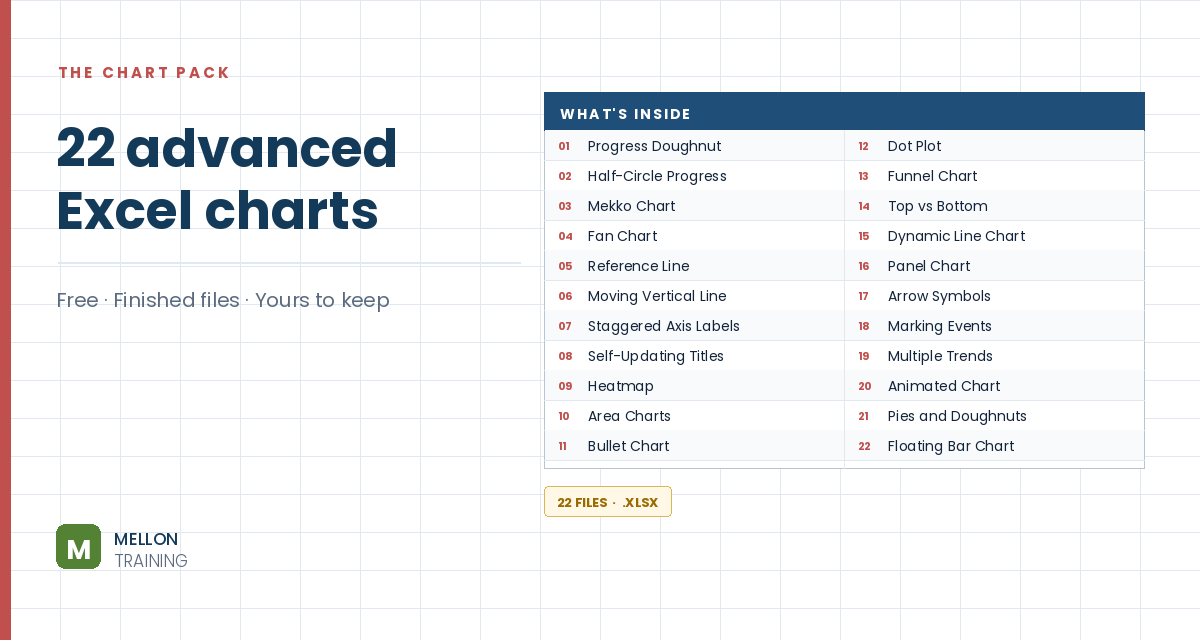
What’s in the pack
Free, instant, and yours to keep.
No spam, ever. Unsubscribe with one click.
One practical Excel tip a week.
Watch the 5-minute video or follow the written steps below. The free chart pack above has 20 more advanced charts, finished and working.
A population (or age) pyramid shows males and females side by side for each age group, with bars running in opposite directions from a central axis. The trick is simple: make one side’s values negative, then use a bar chart.
The example lists age groups, the number of males (column B) and females (column C) in each group, and a total for each sex in row 23.
Add two columns, Male % and Female %. Percentages make the two sides comparable, and making the male side negative is what pushes its bars to the left.
=0-(B4/$B$23)=C4/$C$23The dollar signs keep the totals fixed as you copy the formulas down. Format both columns as percentages (two decimals if you like). You can hide columns B and C once the percentages are in place.
Select the age groups and the two percentage columns, and insert a clustered bar chart.
Right-click the vertical axis and choose Format Axis. Under Labels, set Label Position to Low, which moves the age groups to the left edge instead of the middle. Also tick Categories in reverse order so the youngest group is at the bottom.
Delete the gridlines. Select one of the bar series and, in Series Options, decrease the Gap Width and increase the Series Overlap, so the male and female bars line up on the same row.
Colour the bars (the video uses blue for male and pink for female), adjust the horizontal axis label position, and change the chart title if you want. Your pyramid chart is ready.
YOUR NEXT STEP
Almost every “how did they build that” chart is the same idea — a helper column feeding an invisible series. Once you spot the pattern you stop needing tutorials. You look at a chart and think “that’s two series stacked, one of them hidden”, and you’re usually right.
30-day money-back guarantee, handled by Udemy. No forms, no questions.
★★★★★ Join 80,000+ students
Andreas Exadaktylos · Microsoft-certified Excel instructor · mellontraining.com
WATCHING ON YOUTUBE?
11 step-by-step courses on Excel, Power BI, Python and AI, all on Udemy with lifetime access.