
THE DASHBOARD PACK
Kanban board, habit tracker, KPI report, search bar and more — built, working, ready to take apart. Free, instant, yours to keep.
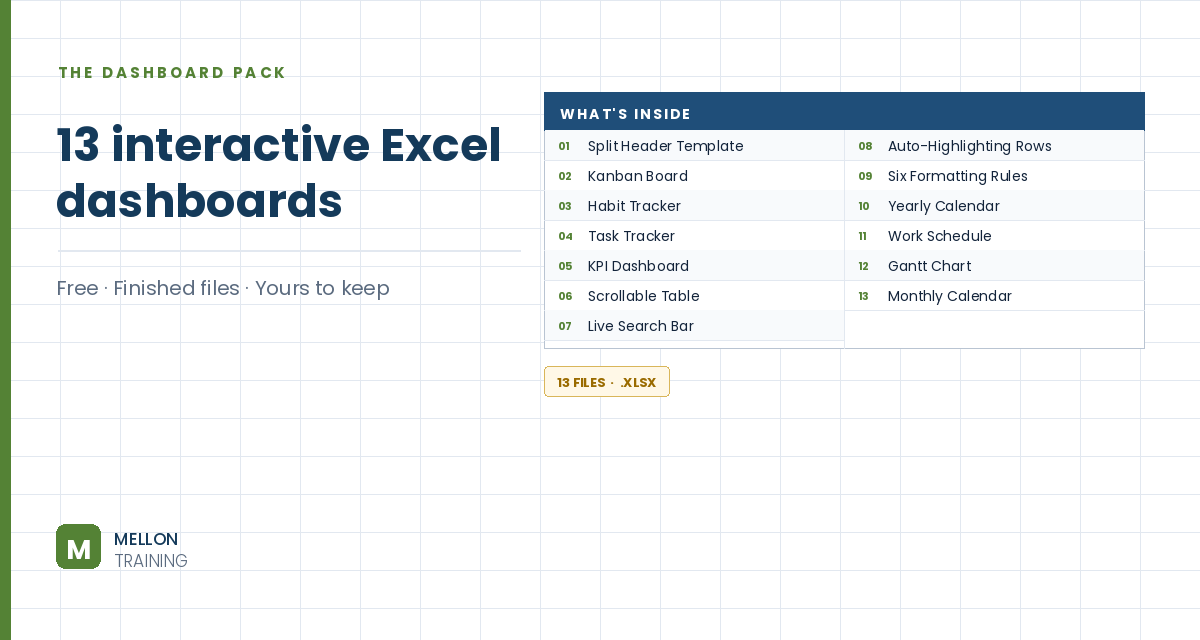
What’s in the pack
Free, instant, and yours to keep.
No spam, ever. Unsubscribe with one click.
One practical Excel tip a week.
Watch the full build (1 hour 18 minutes) or follow the main stages below. The finished dashboard template is in the free pack above.
A complete one-page KPI dashboard tracking sales, staffing and customer metrics: actual vs plan, order volumes, new hires and terminations, sick days, wait times, satisfaction and Net Promoter Score. The workbook is structured the professional way, inputs then calculations then dashboard, and a region slicer filters everything with one click. These are the main stages; the finished file is in the free download.
An assumptions sheet holds the settings (such as the year and the plan figures) and the raw data sheets hold the transactions. Nothing on the dashboard is typed by hand: everything is calculated from these inputs.
A calculations sheet uses SUMIFS to total sales by month, department, type and region, both actual and plan. SUMIFS adds up a column only where several conditions are all true, which makes it the workhorse of most dashboards.
COUNTIFS counts the number of orders that meet the same kinds of conditions, giving order volumes by month and region.
More SUMIFS formulas total new hires, terminations and sick days for each month, ready for the HR charts.
For grid-shaped tables, such as Net Promoter Score and wait times by month and region, SUMPRODUCT pulls the right value with several criteria at once, where SUMIFS gets awkward. Customer and employee satisfaction scores are calculated the same way.
The key figures are moved onto the dashboard page, and conditional formatting with custom icon sets shows at a glance whether each KPI is on or off target.
Column charts compare actual and planned sales; a PivotTable ranks salesperson performance; stacked column charts show hires, terminations and sick days; and doughnut charts display the satisfaction scores.
Finally, a slicer for region is connected to the PivotTable and the calculations, so one click filters the whole dashboard to a single region.
YOUR NEXT STEP
Every dashboard in this pack rests on the same three techniques: conditional formatting, data validation and dynamic formulas. Learn those properly and you stop collecting templates — you build whatever the job actually needs.
30-day money-back guarantee, handled by Udemy. No forms, no questions.
★★★★★ Join 80,000+ students
Andreas Exadaktylos · Microsoft-certified Excel instructor · mellontraining.com
WATCHING ON YOUTUBE?
11 step-by-step courses on Excel, Power BI, Python and AI, all on Udemy with lifetime access.