The build, stage by stage
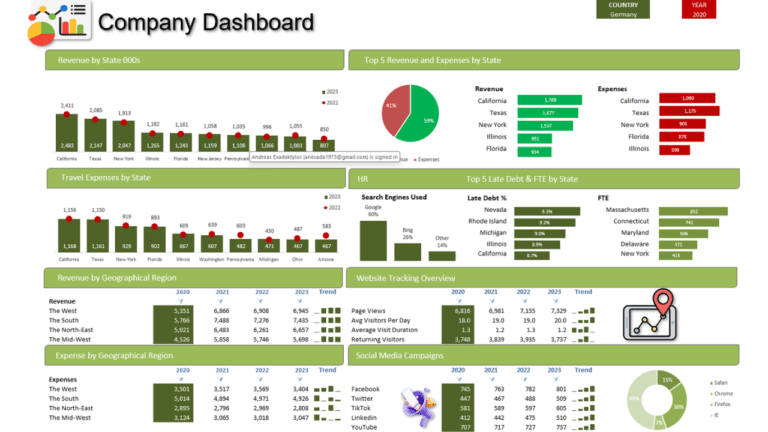
A one-page company dashboard built from scratch: financial results, regional performance, social media campaigns and web traffic, all driven by a year selector. The video is a full one-hour build; these are the main stages, and the finished file is in the free download.
1. Explore the data sheets
The workbook has separate sheets for lists (years, regions, months), social media data and financial data. Keeping raw data, calculations and the dashboard on separate sheets makes the whole thing easier to maintain.
2. Build a calculations sheet
All the numbers the dashboard shows are worked out on a calculations sheet first. The video uses INDEX and MATCH to pull values for the selected year, LARGE to find the top revenue and expense items, and SUMIFS to total values that meet several conditions, such as a region and a year.
3. Add lookups that follow the year
HLOOKUP and XLOOKUP fetch each month’s figures for the chosen year, so every chart can read from one tidy block of results.
4. Region and campaign totals
SUMIFS formulas total sales by region and the results of each social media campaign, ready for the charts.
5. Add the controls
On the dashboard sheet, a drop-down made with Data > Data Validation > List lets you pick the year. Every formula refers to that cell, so the whole dashboard updates when it changes.
6. Sparklines and a combo chart
Column Sparklines show each region’s trend in a single cell. A clustered column and line combo chart, with custom markers, compares revenue and expenses month by month.
7. Pie, bar, column and doughnut charts
A pie chart and horizontal bar charts show the top revenue sources and expenses; column and doughnut charts show web traffic and browser share.
8. Highlight the active year
A formula-based conditional formatting rule highlights the data for the year selected in the drop-down, so it’s easy to see which figures the charts are showing.
Go further
My Excel Dashboard & Data Analysis Masterclass course builds ten dashboards like this one, every workbook included.