Step-by-step
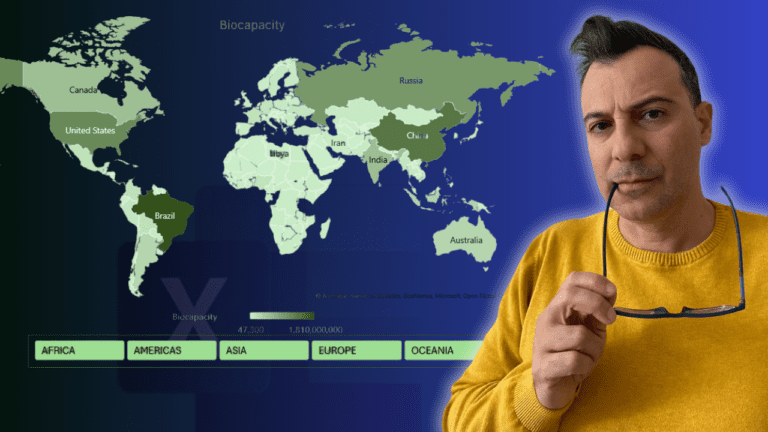
A filled world map that compares countries’ biocapacity, plus a slicer that zooms the map to one region at a time. The data, from the Global Footprint Network, lists countries, their region, biocapacity and ecological footprint. Map charts need Excel 2019 or Microsoft 365.
1. Insert the map
Select the country and biocapacity columns (click B3:C3, press Ctrl+Shift+Down, then scroll back up). Go to Insert > Maps > Filled Map. If Excel can’t recognise a place, a message appears at the top of the chart.
2. Stop the chart resizing
Hiding rows makes the chart shrink. Open Format Chart Area (Ctrl+1) > Properties and choose Don’t move or size with cells. This is worth doing for any chart on a dashboard.
3. Choose the projection and area
Click a country to open Series Options. Pick a Map projection (Miller works well). Under Map area, choose Only regions with data. That hides countries without data and, importantly, lets the map zoom in when you filter later.
4. Labels and colours
Set Map labels to Best fit only; showing all crams them in. Under Series Color, choose a pale green for the lowest value and a vivid green for the highest. Move the legend to the bottom and add the title Biocapacity.
5. Turn the data into a table
Slicers need a table or PivotTable. Click inside the data, go to Insert > Table and click OK. Change or switch off the table style if you like.
6. Add a region slicer
On Table Design, click Insert Slicer and tick Region. Move it under the map, set more Columns on the Slicer tab so it fits the width, and pick a green slicer style.
7. Filter the map
Click Americas and the map zooms to the Americas; click Europe or Asia and it follows. Clear the filter (top right of the slicer) to see the whole world again.
Go further
My Excel Charts, Infographics & Data Visualisation course teaches 20+ advanced charts and maps from a blank sheet.