
THE CHART PACK
Mekko, fan chart, bullet, gauge, waterfall — the ones Excel won’t build for you. All finished and working. Free, instant, yours to keep.
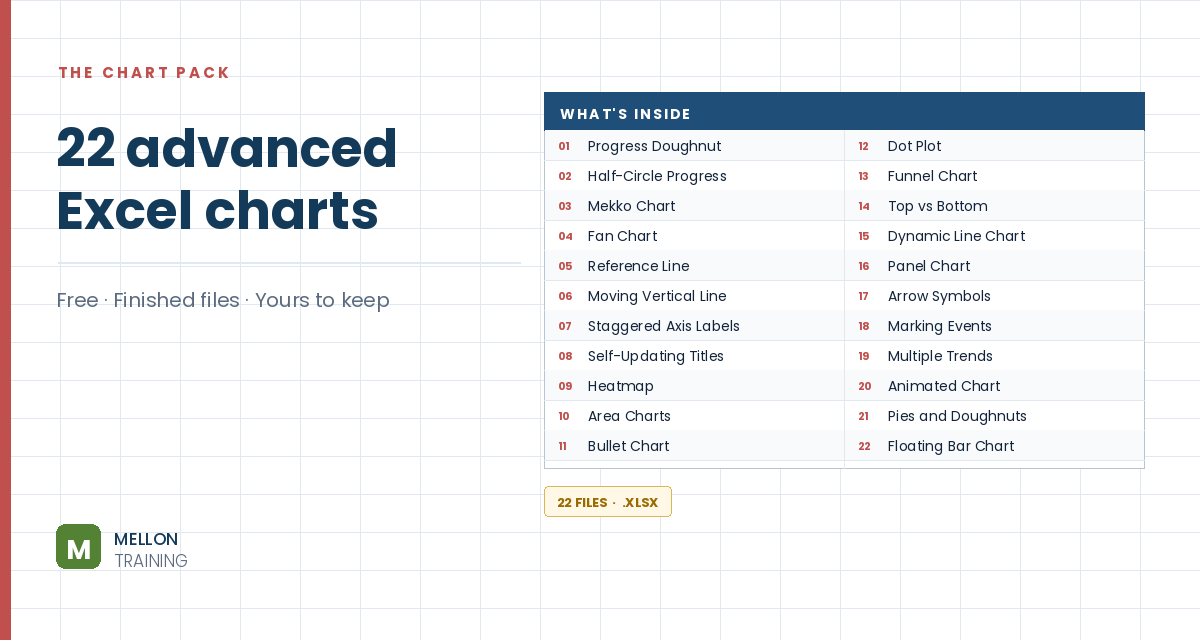
What’s in the pack
Free, instant, and yours to keep.
No spam, ever. Unsubscribe with one click.
One practical Excel tip a week.
Watch the 6-minute video or follow the written steps below. The free chart pack above has 20 more advanced charts, finished and working.
Excel has four stock chart types, and which one you can use depends on the columns you have. With three price series (high, low, close) you can use the first type. With open, high, low, close and volume, you need the fourth. The example is a stock’s daily data from late August to the end of October.
Select your data except the volume column, go to Insert > Stock chart and choose the second type (Open-High-Low-Close). Move it into place.
Click the horizontal axis and, on the Home tab, reduce the font size to 6 so more dates fit.
Starting the price axis at 0 wastes most of the chart. Double-click the vertical axis and, in Axis Options, change the Minimum bound to just below your lowest price (30 in the example). Leave the maximum (60) as it is. The price movements are now much easier to see.
Select all the data, including volume, and go to Insert > Stock. The first three types are greyed out because of the volume column, so choose the fourth (Volume-Open-High-Low-Close). This chart has two vertical axes: price on the left and volume on the right.
Double-click the horizontal axis, go to Size & Properties > Alignment, set the text direction to vertical, and reduce the font size to 6.
To show each price series explicitly, select the chart and go to Chart Design > Change Chart Type > Combo. Set Open, High, Low and Close to Clustered Column, and Volume to Clustered Column on the secondary axis. This shows everything, but it gets noisy, so use it only when you need the detail.
Stock charts aren’t just for share prices: any data with a high, low and close works, such as daily temperatures.
YOUR NEXT STEP
Almost every “how did they build that” chart is the same idea — a helper column feeding an invisible series. Once you spot the pattern you stop needing tutorials. You look at a chart and think “that’s two series stacked, one of them hidden”, and you’re usually right.
30-day money-back guarantee, handled by Udemy. No forms, no questions.
★★★★★ Join 80,000+ students
Andreas Exadaktylos · Microsoft-certified Excel instructor · mellontraining.com
WATCHING ON YOUTUBE?
11 step-by-step courses on Excel, Power BI, Python and AI, all on Udemy with lifetime access.