
THE CHART PACK
Mekko, fan chart, bullet, gauge, waterfall — the ones Excel won’t build for you. All finished and working. Free, instant, yours to keep.
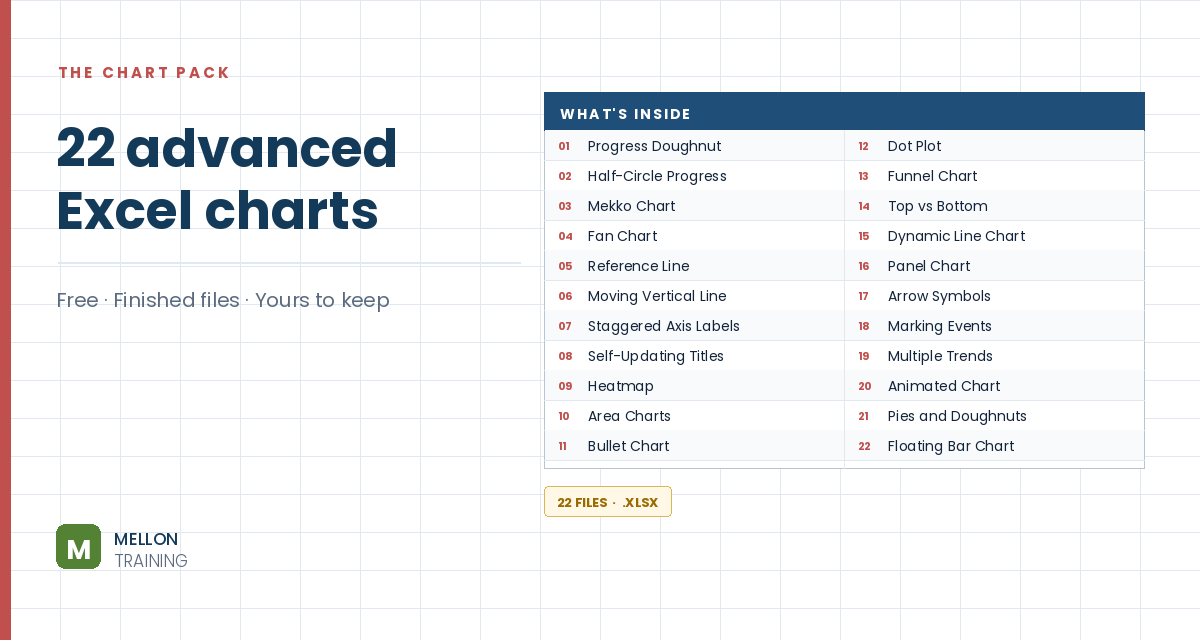
What’s in the pack
Free, instant, and yours to keep.
No spam, ever. Unsubscribe with one click.
One practical Excel tip a week.
Watch the 3-minute video or follow the written steps below. The free chart pack above has 20 more advanced charts, finished and working.
A bidirectional (or mirror) bar chart puts two series back to back, with bars running left and right from a central axis. It’s a great way to compare two periods side by side. The example compares sales of three products in 2014 and 2015.
Select the data (A1:C4: product names plus the two years) and go to Insert > Clustered Bar.
Right-click the legend, choose Format Legend and select Top.
Right-click one of the series, choose Format Data Series and select Secondary Axis. The chart now has two horizontal axes, one at the top and one at the bottom.
Right-click the secondary axis and choose Format Axis. Set the minimum to the negative of your largest value, the maximum to the positive, and a sensible major unit. The example’s largest value is 5,600, so it uses −6000, 6000 and 1000. Tick Values in reverse order.
Then format the primary axis with the same minimum, maximum and unit, but leave Values in reverse order unticked. The two series now run in opposite directions.
The product labels sit in the middle of the chart. Right-click the vertical axis, choose Format Axis, and set Major tick mark and Minor tick mark to None and Label Position to Low.
Optionally, hide the minus signs on the axis using a custom number format. Delete the gridlines, add a chart title, and your bidirectional bar chart is ready.
YOUR NEXT STEP
Almost every “how did they build that” chart is the same idea — a helper column feeding an invisible series. Once you spot the pattern you stop needing tutorials. You look at a chart and think “that’s two series stacked, one of them hidden”, and you’re usually right.
30-day money-back guarantee, handled by Udemy. No forms, no questions.
★★★★★ Join 80,000+ students
Andreas Exadaktylos · Microsoft-certified Excel instructor · mellontraining.com
WATCHING ON YOUTUBE?
11 step-by-step courses on Excel, Power BI, Python and AI, all on Udemy with lifetime access.