
Prefer reading? The same steps are written out below the video.
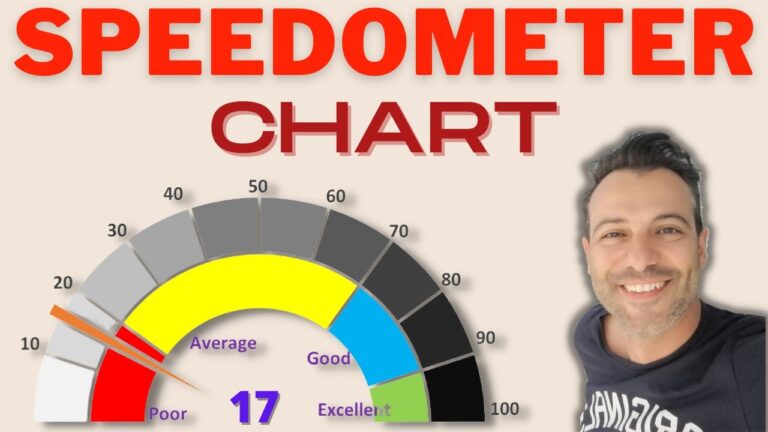
A gauge (or speedometer) chart tracks a single number against its target, with a needle that moves when the data changes. You build it from two doughnut charts and one pie chart, layered on top of each other.
Go to Insert > Doughnut to get a blank chart. Right-click it, choose Select Data > Add, name the series Category and select B3:B7 as the values.
Right-click the chart, choose Format Data Series and set Angle of first slice to 270°. Then right-click only the bottom half, choose Format Data Point and set it to No fill. Colour the remaining four bands (the video uses red, yellow, blue and green).
Right-click the chart, choose Format Data Labels, tick Value From Cells and select the labels next to the first table.
Select Data > Add again, name the series Labels and select the values column of the second table. Repeat step 3: hide the bottom half and colour the rest. For its data labels, tick Value From Cells, select D3:D13 and untick Value, otherwise every label shows the same number.
Select Data > Add a third series named Pointer with H3:H5 as the values. Excel draws it as another doughnut, so right-click and choose Change Series Chart Type and set the third series to Pie. Check its angle is 270° too. Give the two large pie slices No fill, so only the thin sliver is left. That’s your needle. To make it stand out, open Format Data Point and set Point Explosion to 5%.
Go to Insert > Text Box and draw it in the centre of the gauge. With the text box selected, type = in the formula bar and click the cell that holds the pointer value. The box now updates whenever the data does. Finally, delete the legend and tidy the label positions.
My Excel Dashboard & Data Analysis Masterclass course shows you how to build 10 interactive dashboards from scratch, where gauges like this are a regular feature.
WATCHING ON YOUTUBE?
11 step-by-step courses on Excel, Power BI, Python and AI, all on Udemy with lifetime access.