
Prefer reading? The same steps are written out below the video.
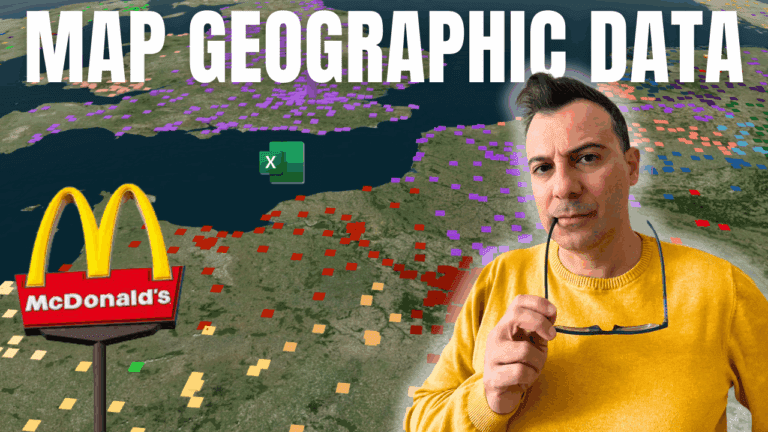
Excel’s 3D Maps plots thousands of locations on an interactive globe. The example maps every McDonald’s store in the world, about 39,000 rows from a public Kaggle data set, using each store’s latitude and longitude.
In a blank workbook, go to Data > Get Data > From File > From Text/CSV, choose the file and click Load. Excel loads it as a table.
Delete columns you won’t map, such as store ID, phone number and opening hours. Keep country, city, address, postcode, latitude and longitude.
Click inside the table, press Ctrl+A, and go to Insert > 3D Map > Open 3D Maps. A new window opens and Excel plots the stores using the latitude and longitude columns.
Scroll to zoom and drag to rotate, or use the on-screen arrows to tilt. Turn Map Labels on to show country and city names, and try the Themes gallery for satellite or dark globe styles.
In the Layer Pane, check the Location fields (latitude and longitude for exact points, or country to summarise by country). Under Layer Options, adjust the opacity and colour. Drag country into Category to colour the points by country.
Change the visualisation type to Heat Map to see where stores are most concentrated, with hot spots around cities such as New York, London and Tokyo.
If your data has a date, such as an opening date, drag it into the Time box. A timeline appears and Play animates the map, perfect for showing growth over the years.
My Excel Power Query, Power Pivot, DAX & Power 3D Map course covers 3D Maps, Power Query and data models in depth.
WATCHING ON YOUTUBE?
11 step-by-step courses on Excel, Power BI, Python and AI, all on Udemy with lifetime access.