
THE CHART PACK
Mekko, fan chart, bullet, gauge, waterfall — the ones Excel won’t build for you. All finished and working. Free, instant, yours to keep.
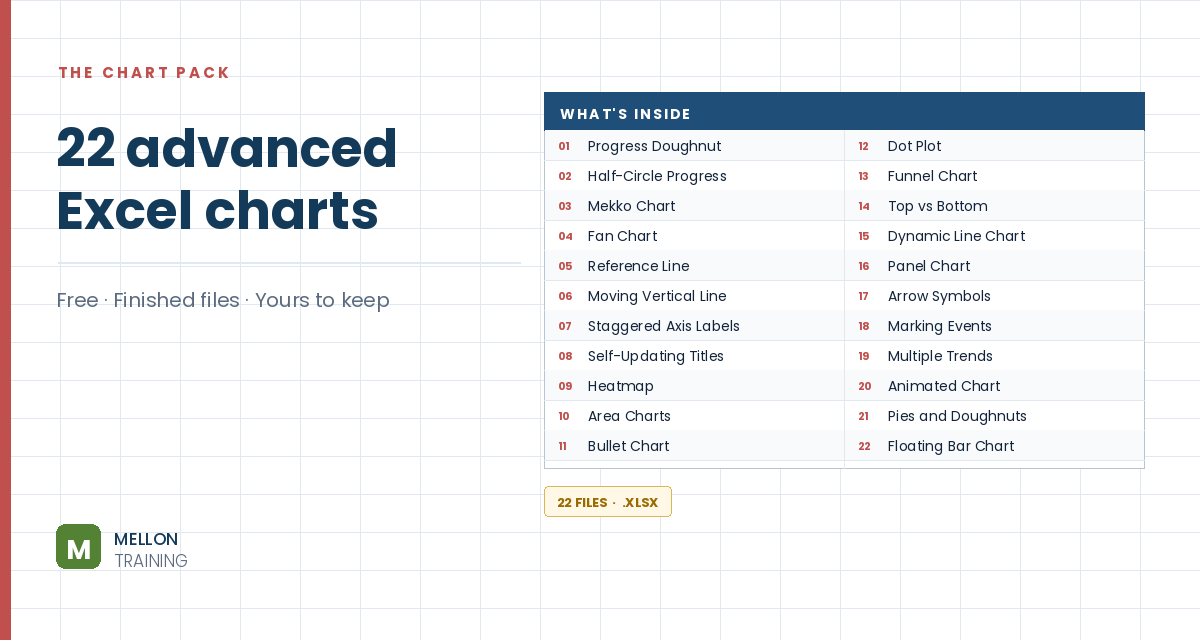
What’s in the pack
Free, instant, and yours to keep.
No spam, ever. Unsubscribe with one click.
One practical Excel tip a week.
Watch the 6-minute video or follow the written steps below. The practice file is in the free pack above.
A typed chart title goes stale the moment the data changes: the numbers say Q2 but the title still says Q1. Link the title to a cell instead and it updates itself. You can even make it calculate things like growth.
Type your title in a cell, for example 2026 Annual Revenue Comparison in A1.
Click the chart title once so it’s selected. Click in the formula bar at the top, type =, click A1 and press Enter. Now when you change A1, the title changes too.
In the example, years are in row 4 (2025 in B4, 2026 in C4) and the totals in row 9. In an empty cell such as A12:
=C4&" revenue went up by "&INT((C9-B9)/B9*100)&"% from "&B4
The ampersand (&) joins text and numbers together, so mind the spaces inside the quotes. INT rounds the growth down to a whole number so there are no long decimals. The result reads 2026 revenue went up by 31% from 2025, and it’s all calculated from the data.
Click the chart title, type = in the formula bar, click A12 and press Enter. Change the data and the whole sentence rebuilds itself. The same idea works for things like Top region: North, which flips to South if South’s revenue overtakes it.
YOUR NEXT STEP
Almost every “how did they build that” chart is the same idea — a helper column feeding an invisible series. Once you spot the pattern you stop needing tutorials. You look at a chart and think “that’s two series stacked, one of them hidden”, and you’re usually right.
30-day money-back guarantee, handled by Udemy. No forms, no questions.
★★★★★ Join 80,000+ students
Andreas Exadaktylos · Microsoft-certified Excel instructor · mellontraining.com
WATCHING ON YOUTUBE?
11 step-by-step courses on Excel, Power BI, Python and AI, all on Udemy with lifetime access.