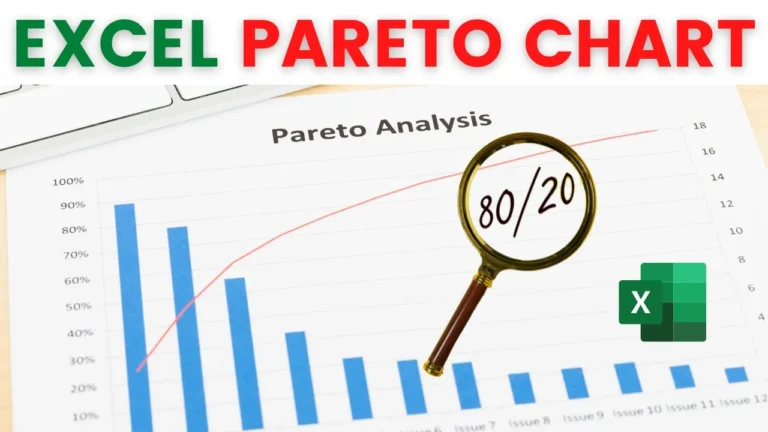
Roughly 80% of your problems come from about 20% of the causes. A Pareto chart
is how you find out which 20%.
It combines a column chart with a cumulative percentage line, so the few items
driving most of the total become obvious at a glance. In this tutorial we build
one from scratch — sorting the data, adding the cumulative column, and getting
the secondary axis to line up properly.