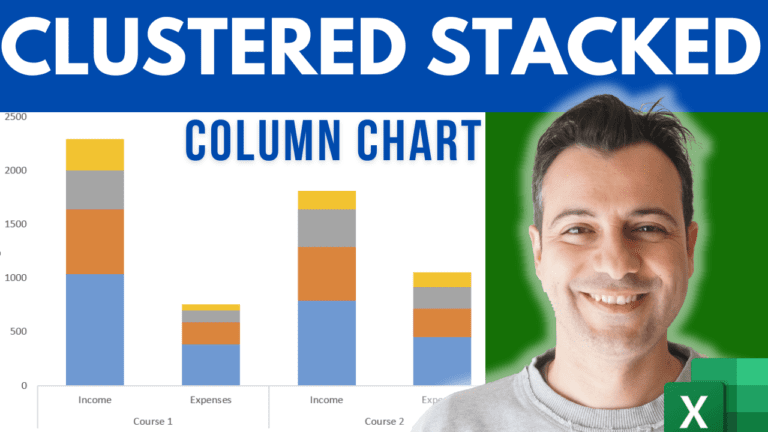
Excel gives you clustered columns. Excel gives you stacked columns. What it won’t give you is both at once — which is exactly the chart you need when you’re comparing categories that each break down into parts.
There’s a workaround, and it takes about two minutes. It isn’t a hidden chart type; it’s how you lay out your data before you insert the chart.